Easily create editable curves to custom images in few steps.
- Click Add Curves icon
 in vertical toolbar
 - Select location to define a start point of the curve
- Click on a location to define an endpoint of the curve
- Drag the mouse on the image to edit the curvature of the curve
- Right click to confirm the curvature
- For modifying the position of the curve, you have to:
- Click Select / Drag and object icon
 in horizontal toolbar
 - Select a curve on the image
- Select dots of the curve to edit position of the startpoint, endpoint and the curvature
- Click Select / Drag and object icon
- After editing the position, edit the settings in Map Curve Properties panel at the bottom of the iMapBuilder HTML5 map editor
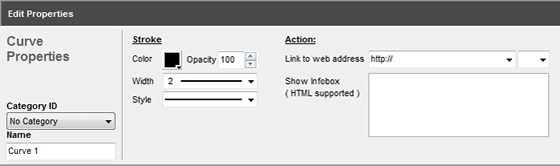
| Properties | Descriptions |
|---|---|
| Name | Name of the curve |
| Category ID | Assign the curve to a category |
| Color | Color of the curve |
| Opacity | Opacity of the curve (0-100) |
| Width | Thickness of the curve |
| Style | Style of the curve (e.g. solid, dot, dash) |
| Symbol | Select symbol for Start & End point |
| Link to web | Insert link to the curve |
| Address | Select destination to open the hyperlink: New Window / Same Frame / Parent Frame / Root Frame |
| Show Infobox | - Insert content (e.g. text, image, video, table, etc.) to the curve when mouseover it - HTML code is supported If you are not familiar with coding, you could add infobox content using Rich Text Editor.
|
[ Back ]