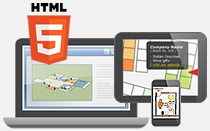
This diagram above shows a timezone map with stock markets overlayed as pins. Clicking on each pin reveals the stock market details including the name, indices, a graph showing the up and downs and the recent weather for the city.
The information box of this diagram is specially crafted using HTML and CSS. iiCreator supports HTML and CSS markups for the content of the information boxes, so you can apply your own text formatting and styles to match your website or blog.
This timezone map can be further expanded and here are some ideas:
- Connect to your database or any third-party RSS feed, JSON or XML data source to supply the content of each pin. The stock indices can show real time figures and the weather data of the city is refreshed when the map loads.
- Create charts or graphs to show how the indices perform. Even if your map is not related to finance, we can create any charts or graphs to present your data.
- Further customization for the look and feel of the map or diagram to fit your specific needs, like color scheme, container dimensions, header/footer arrangements etc.
- Show details in a panel or sidebar instead of popup boxes. This can be useful if you have a lot of information to show per pin.
- Search function for textual content in the diagram.
Custom Diagram Creation Service
Don't have time to create a diagram like this? Simply send us your diagram details for a free consultation. Remember to state your desired budget for us to determine the features we can customize for your diagram.
